Network Monitor Dashboard
It’s a new world for network engineers to know Programming and automation (boring stuff they do every day)
I have many tasks which need to be done automatically to get the output as expected. It’s been a Long time since I thought about it and wanted to do it, but I never got the time or enough hands-on experience on how these things work.
I have contacted some of them who have done this, but due to their busy lives, they may not be able to assist me or guide me in a better way.
some people in known circle told me what to use how to use – that put my ideas on the table to work
so kindly bare with me this Beta of my testing, this may be not be 100% in production environment, but you can use and share how ever way you like – make sure you understand the script if you like to run them (if you are using in production just be cautious to use).
Before I delve into the details, let’s begin with the idea.
As I stated at the beginning, I would like to automate many tedious tasks to obtain results in my email or GUI report, so I do not need to visit each device and manually review what I am trying to achieve.
Small Lab setup :
- Ubuntu 24. X LTS
- FastAPI and Python virtual environment
- I used some known tools, high-level – Netmiko, PyATS, Gennie, and PostgreSQL to manage all data in the database
- Create a virtual environment to build some switches for testing (later, I will test it in a real environment to see how that works).
I will explain in detail the steps I have taken to install the app from scratch. For now, I am focusing on the app.
Lab Topology:
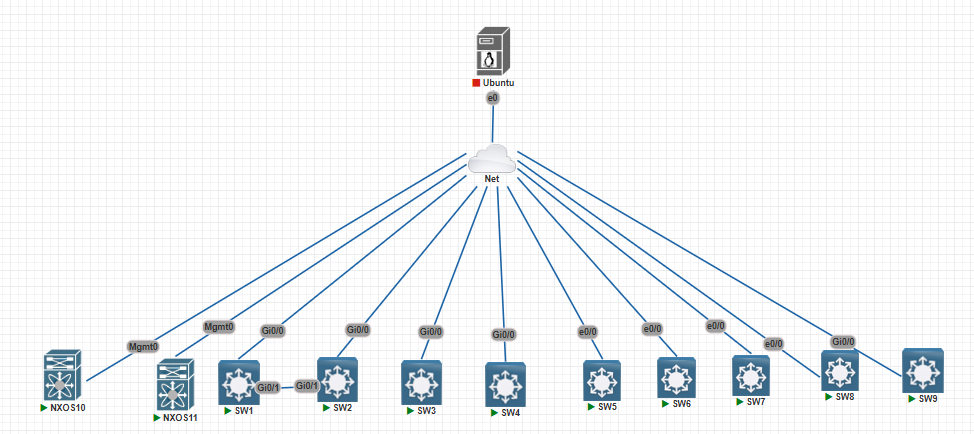
All management IP and Ubuntu IP are in the same range for ease of use. That is 192.168.X.X/24
Lab Setup
OS: Ubuntu 24. X LTS
Tools: FastAPI, Python, Netmiko, PyATS, Genie, PostgreSQL
Lab topology diagram
Application Features
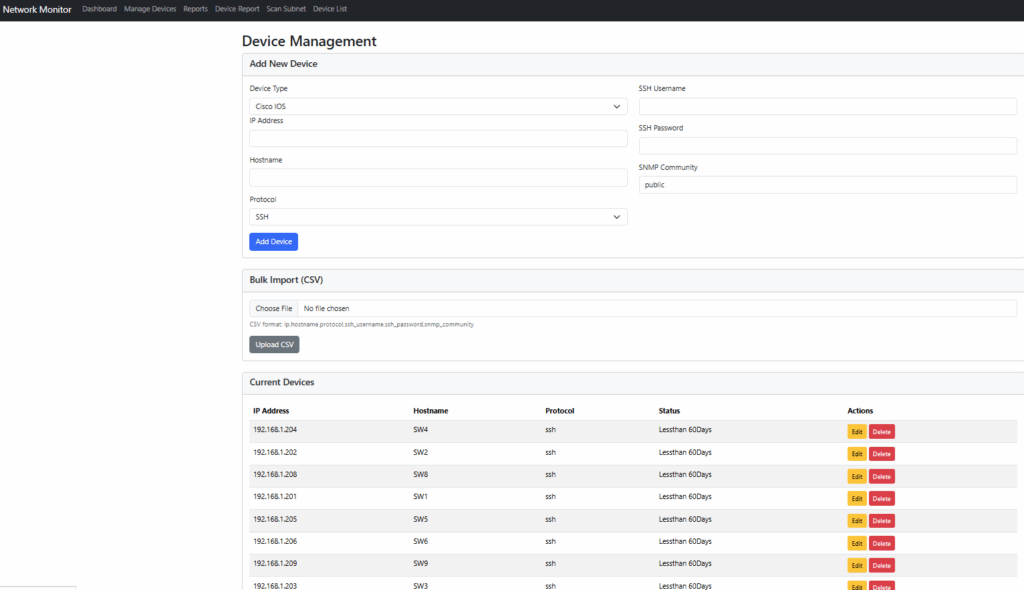
Device management (add/edit/delete)
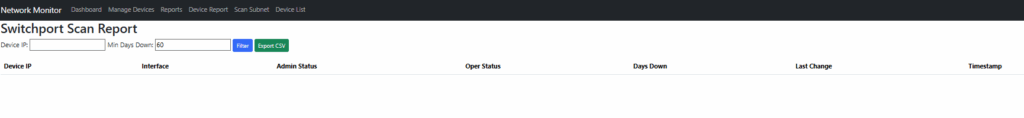
Switchport report (ports down >60 days, CSV export)
Device report (detailed device stats)
Subnet scan (multi-processing, SSH, OS detection)
Dashboard preview and planned improvements
Lessons Learned
Learning curve, using AI, and community support
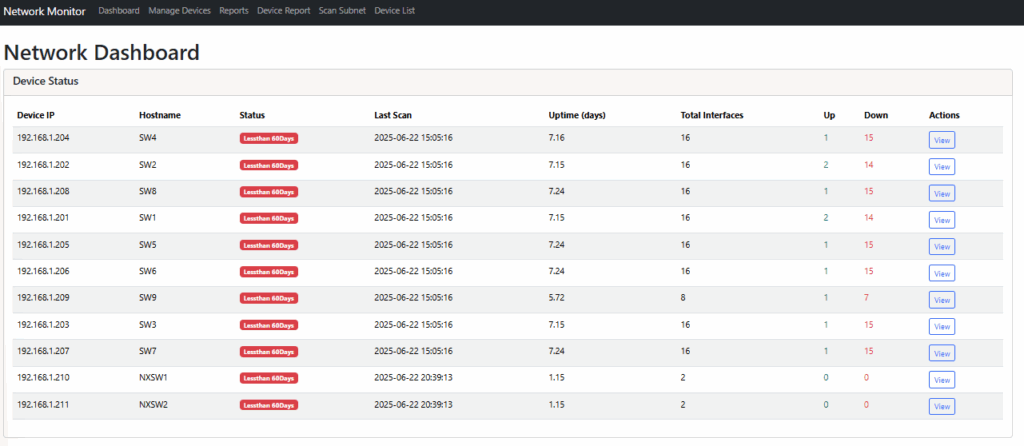
Show the device information:
Manage Devices (you can manage devices, adding, editing, and deleting for now.)
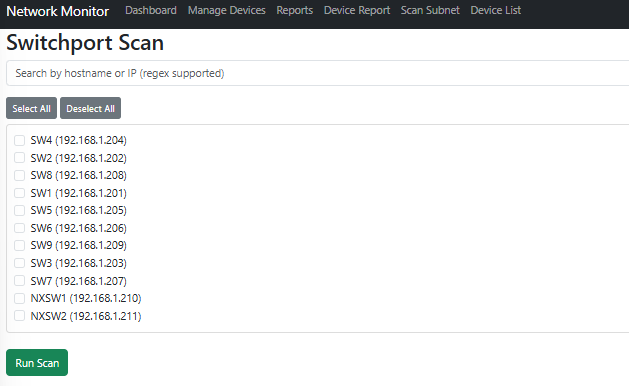
Switchport report (the port was down for more than 60 days and not in use) – one of the requirements, and a CSV file can be downloaded.
Device Report – You can select a specific device or all devices to scan and obtain a Device Switchport Report.
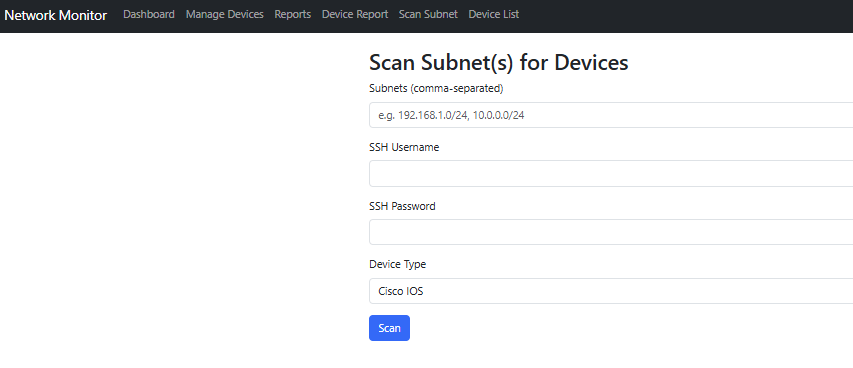
Scan Subnet – Scan an entire subnet with username and password input, using SSH, and determine the switch name and IP. Store the information in a database. This process supports multi-threading. The option allows for scanning either IOS or Nexus OS for now.
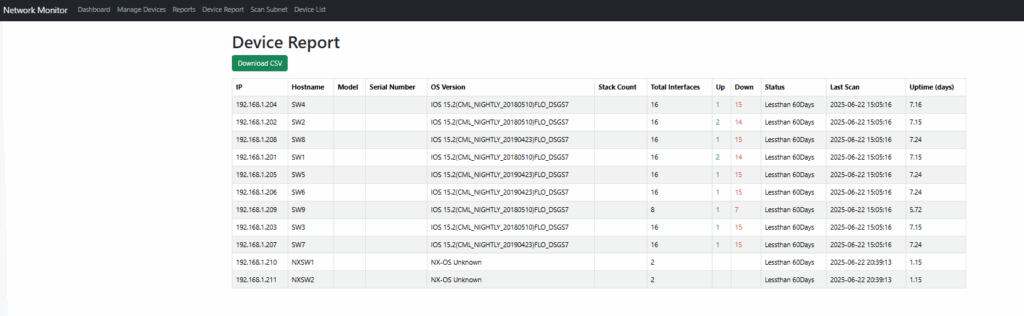
Device Report – This provides comprehensive information about all devices scanned in the network, including the following details, as illustrated in the screenshot.
IP, Hostname, Model, SN, OS (IOS Code), Stack count (number of switches in the stack), Total Interfaces in the device, number of up and down interfaces, time the switch has been up, last time this device was scanned, Uptime in days.
I will soon post the code on GitHub and share the information on how it works.
I am more excited about this application. It took me 2 months to learn from scratch and get things going. I should say thank you to the new era of AI for fixing many of my programming errors.
- Cautions
- Beta status, production risks, importance of code review
Thank you again for visiting, and happy Labbiiiiiiiiiiiiiiiiiiiiiiiiiiing!